
This post is also available in:
![]()
![]()
Introduction: the Paradox of the Data Age
Your company is sitting on a gold mine. Right now.
Your CRM systems, your Google Analytics, your social networks, your spreadsheets… each of these platforms generates thousands of data points every day. Data about your customers, your operations, your finances. It’s an unprecedented amount of information.
So why does making strategic decisions still feel like navigating in the fog?
This is the great paradox of the digital age: most companies are “data-rich, but information-poor”. They have the data, yes, but it’s scattered, disorganized, and disconnected. It’s like having all the ingredients for a gourmet banquet, but scattered on the kitchen floor.
In this definitive guide, we’re going to give you the recipe and the tools to cook that banquet. We’ll show you how to build an Intelligent Data Pipeline, an automated system that not only collects and stores your information, but cleans, enriches, and transforms it into actionable insights that drive strategic decisions and profitable growth. Forget about reports that nobody reads; we’re going to build the machine that will tell you exactly what to do next.
1. What is a Data Pipeline? (and What Makes it “Intelligent”)
In its simplest form, a data pipeline is a system that moves data from point A to point B. For example, from your sales database to a visualization tool. A basic pipeline is like a water pipe: it simply transports the resource.
But what if that pipe could also purify the water, analyze its composition, enrich it with minerals, and automatically direct it to the place that needs it most, all in real time?
That’s an Intelligent Pipeline.
It doesn’t just move data; it transforms it along the way. It’s an orchestrated system that uses automation, artificial intelligence, and machine learning to turn raw, chaotic data into a refined, high-value asset.
The fundamental difference:
- Basic Pipeline: Answers the question “What happened?”. (E.g. “We sold 100 units last month”).
- Intelligent Pipeline: Answers the questions “Why did it happen?”, “What will happen next?” and “What should we do about it?”. (E.g. “We sold 100 units because our LinkedIn campaign had 30% more engagement with customers in the technology sector. Our model predicts that if we double the investment in that segment next month, sales will increase by 15%. We should reallocate the budget now.”)
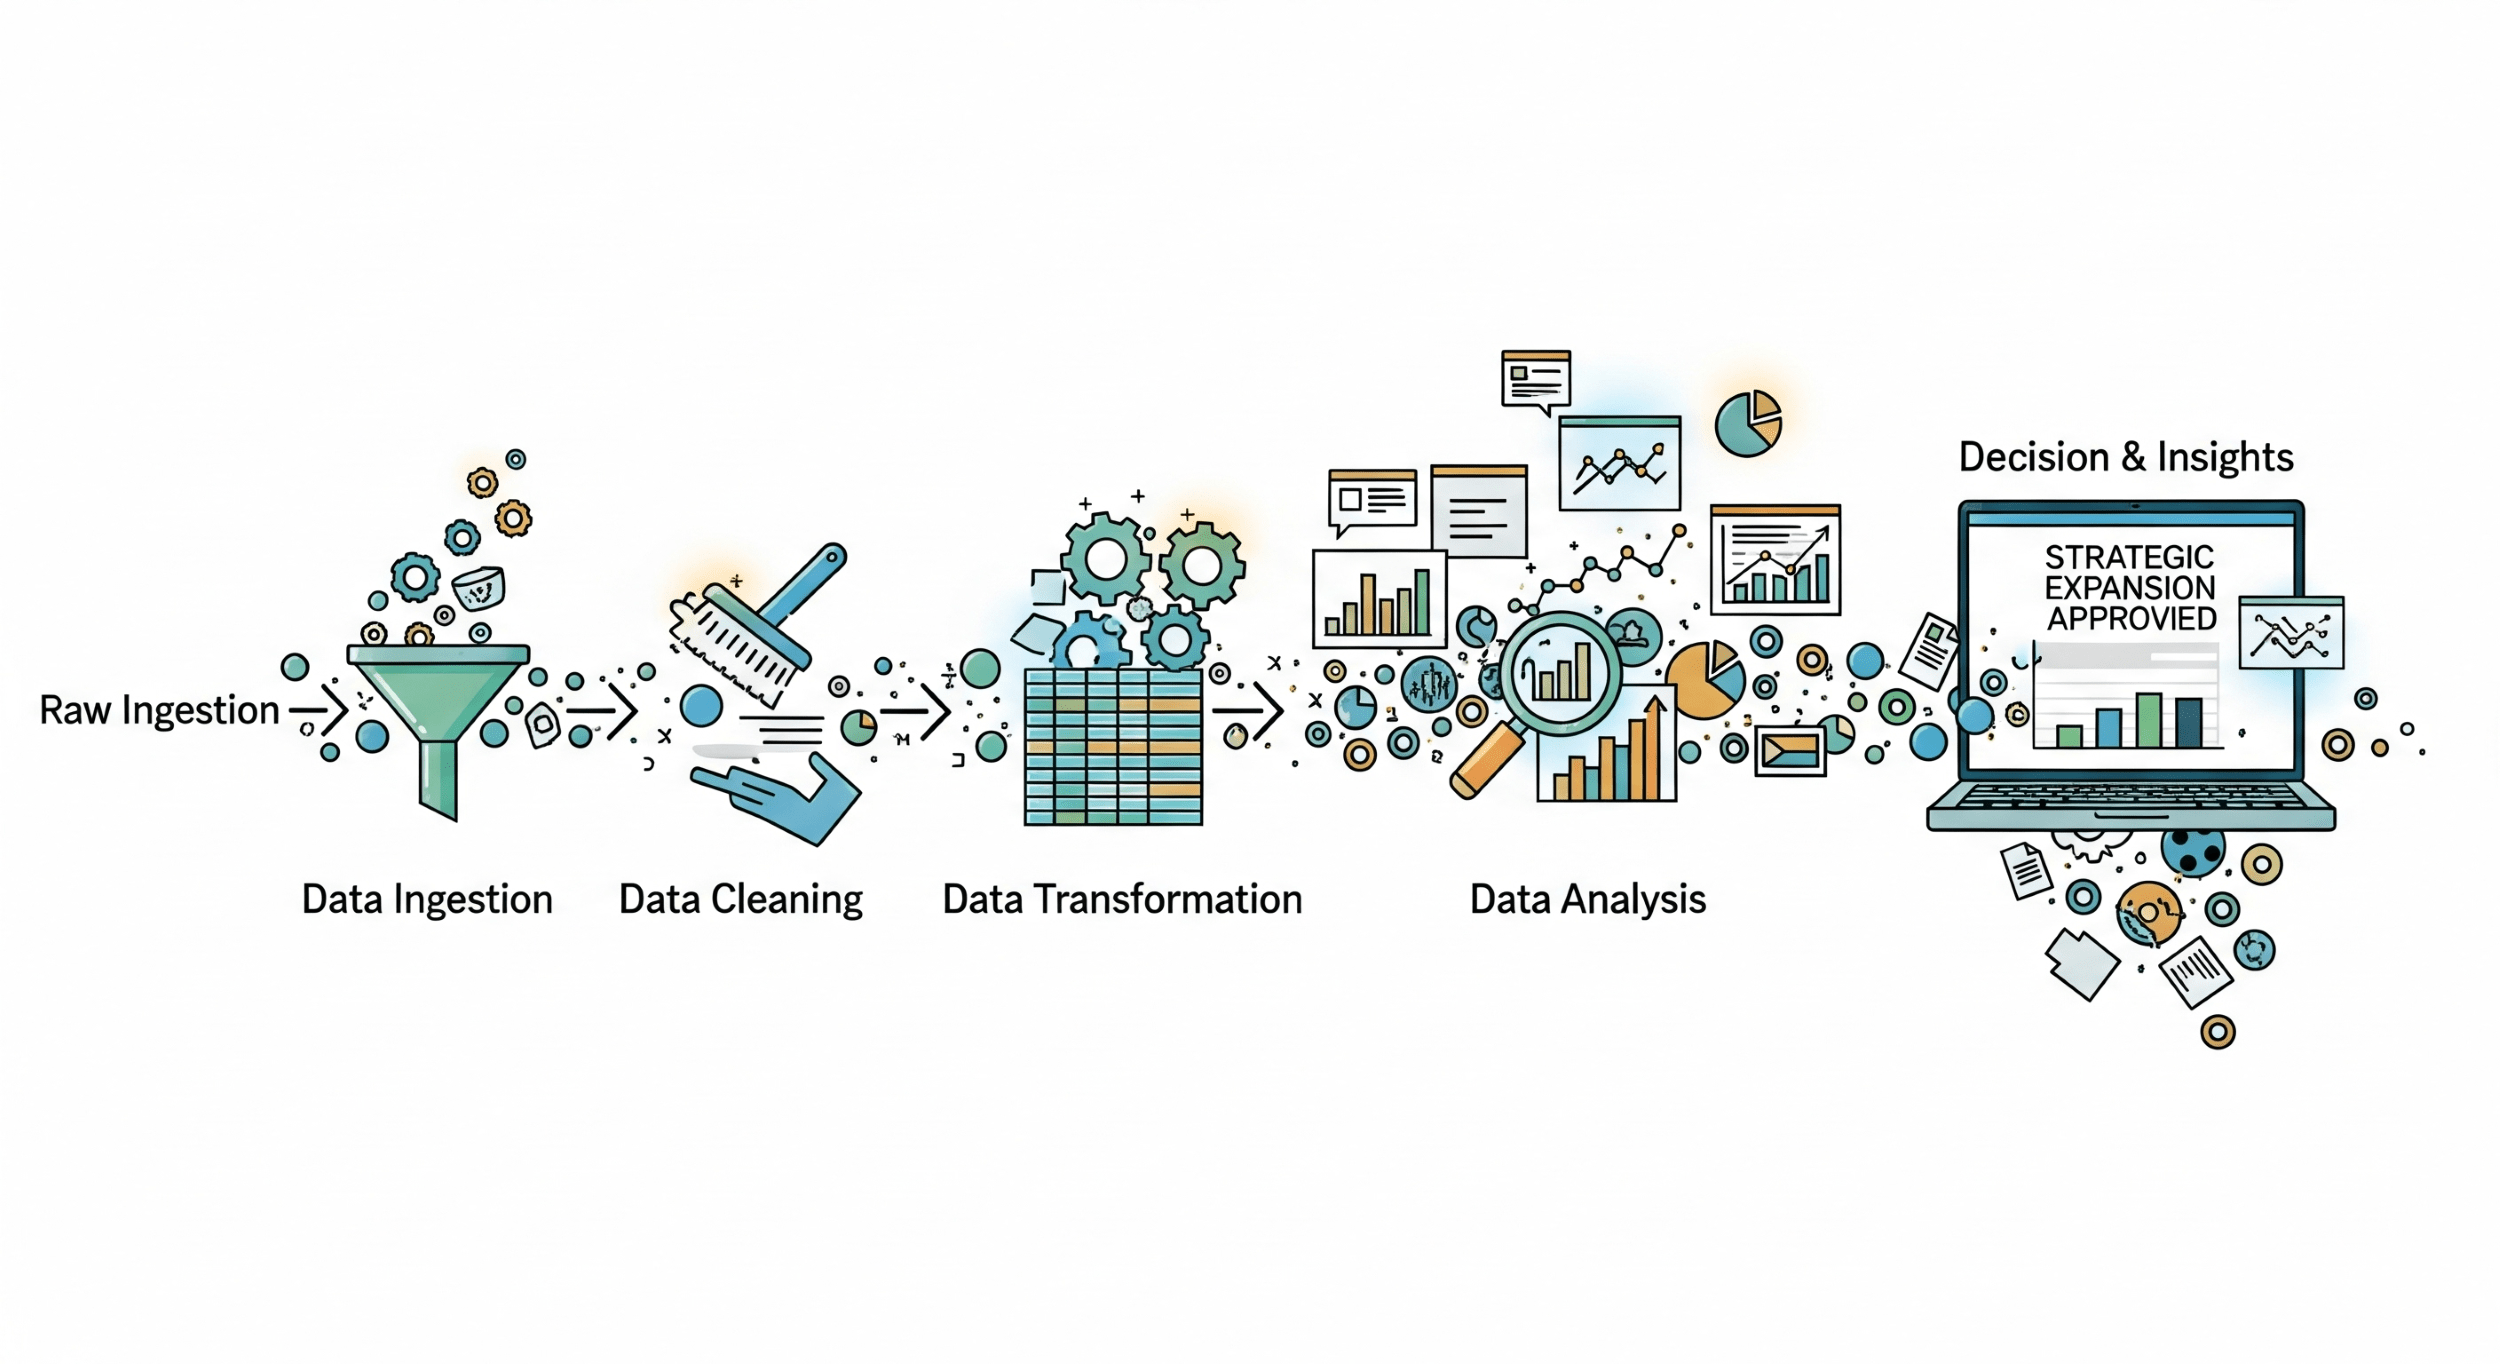
2. The Anatomy of an Intelligent Pipeline: the 5 Crucial Stages
Building an intelligent pipeline is a methodical process. Each stage builds on the previous one, creating a robust and scalable system. Let’s break down each one.
Stage 1: Ingestion (the Collection of Raw Material)
This is where it all begins. The goal is to collect data from all your disparate sources and centralize it.
Common Data Sources:
- Customer Data: CRM (Salesforce, HubSpot), email marketing platforms (Mailchimp).
- Web/App Behavior Data: Google Analytics, Adobe Analytics, Mixpanel.
- Marketing Data: Ad platforms (Google Ads, Facebook Ads), social networks.
- Transactional Data: Company databases (MySQL, PostgreSQL), ERP systems.
- Third-Party Data: Public APIs, demographic databases, market data.
Ingestion Methods:
- Batch Ingestion: Data is collected and moved in blocks at scheduled intervals (e.g., every 24 hours). It is ideal for historical analysis and reports that do not require immediacy.
- Real-Time (Streaming) Ingestion: Data is captured and processed the moment it is generated. It is crucial for applications such as fraud detection or real-time web personalization.
Popular Tools:
- ELT/ETL Platforms: Fivetran, Stitch, Airbyte. These tools offer pre-built “connectors” to hundreds of data sources, automating much of the process.
- Custom APIs: For unique or internal data sources, custom scripts are often built (usually in Python).
Stage 2: Storage (the Cellar and the Warehouse)
Once collected, the data needs a place to live. This is where two key concepts come in: the Data Lake and the Data Warehouse.
- Data Lake: Think of this as a large cellar where raw material is stored in its raw and unprocessed state. The data is stored as it arrives, without a predefined structure. It is cheap, flexible, and perfect for data scientists to explore and find hidden patterns.
- Data Warehouse: This is the organized warehouse. It contains data that has already been cleaned, structured, and optimized for analysis. The information is arranged in tables with defined schemas, which makes queries for business reports incredibly fast.
The modern strategy is not to choose one or the other, but to use both. The data first lands in the Data Lake and then is processed and moved to the Data Warehouse for consumption by business analysts.
Popular Tools (Cloud-Based):
- Google BigQuery
- Amazon Redshift
- Snowflake
Stage 3: Transformation and Enrichment (the Refining Process)
This is the stage where the real “intelligence” happens and where most data projects fail if not done right. Transforming raw data into reliable information is a meticulous job.
Key Processes:
- Cleansing: Remove duplicate records, correct typos (e.g. “Mexico” vs. “México”), standardize formats (e.g. convert all dates to YYYY-MM-DD) and handle null values.
- Structuring: Convert unstructured data, such as the text of an email, into a structured format with defined fields (sender, subject, date, body).
- Enrichment: This is a value multiplier. It consists of combining data from different sources to create a more complete view. For example, taking a customer’s email address and enriching their profile with demographic data from an external API or with their purchase history from the ERP system.
- Aggregation: Calculate metrics and KPIs. For example, from a table of individual sales, the “Total Sales by Region and by Month” is calculated.
Popular Tools:
- dbt (Data Build Tool): The de facto tool for data transformation. It allows analysts to write transformations in SQL in a versionable and testable way, as if it were software.
- Custom Scripts (Python/Spark): For very complex transformations or those involving machine learning.
Stage 4: Analysis and Machine Learning (the Extraction of Gold)
With clean and enriched data in our Data Warehouse, we can now ask the important questions.
The Four Levels of Analysis:
- Descriptive Analysis (What happened?): The basis of everything. These are the dashboards and reports that show historical KPIs. (E.g. “Our sales in the last quarter were $1.2M”).
- Diagnostic Analysis (Why did it happen?): Dig deeper to understand the causes. (E.g. “Sales increased because the ‘Summer2025’ campaign had a 25% higher conversion rate than average”).
- Predictive Analysis (What will happen?): This is where Machine Learning comes in. Models are built that learn from historical data to predict future results. (E.g. “Our propensity model predicts that customers who have purchased Product A and Product B have a 70% chance of purchasing Product C in the next 30 days”).
- Prescriptive Analysis (What should we do?): The most advanced level. Recommends specific actions to optimize a result. (E.g. “The system recommends offering a 10% discount on Product C to this customer segment to maximize the probability of conversion”).
Stage 5: Activation and Visualization (Putting Insights to Work)
The most brilliant insights are useless if they stay in a spreadsheet. The final stage is to make that data accessible and actionable for the entire organization.
Visualization:
- Tools: Looker Studio (formerly Google Data Studio), Tableau, Microsoft Power BI.
- Purpose: Create interactive and easy-to-understand dashboards that allow business teams to explore the data and answer their own questions without the need for an analyst. A good dashboard doesn’t just show numbers, it tells a story.
Activation (Closing the Circle): This is where the intelligent pipeline connects back to business operations.
- Automated Alerts: If the inventory of a key product falls below a threshold, an automatic alert is sent to the purchasing team via Slack.
- Reverse ETL: The insights generated in the Data Warehouse (such as a customer’s propensity score) are sent back to operational tools such as the CRM (Salesforce) or the marketing platform.
- Result: Now, a salesperson can see directly in a customer’s profile in Salesforce: “Propensity Score: 92/100. Recommend Product C”. The decision is integrated into their daily workflow.
Conclusion: your Pipeline is your Competitive Advantage
We have broken down the complete journey: from the chaos of scattered raw data to the clarity of an actionable insight delivered to the right person at the right time.
Building an Intelligent Data Pipeline is not a one-time IT project; it is the construction of a central nervous system for your company. It is a strategic asset that allows you to learn faster, move faster, and make smarter decisions than your competitors.
Start small, focus on a clear business problem, and follow the five stages. By doing so, you will go from being a company that simply has data to being a company that thrives on it.
Ready to Build your Own Decision Engine?
Stop Guessing, Start Deciding
In a strategic call, we will identify the first step to turning your data into a profitable asset.
If you feel your data could be working harder for you, schedule a strategic call. We will analyze your current data ecosystem and show you the path to turning it into your greatest asset.
Now it’s your turn: What is the most important business question you would like to be able to answer with your data, but currently cannot? Leave us your answer in the comments.
This post is also available in:
![]()
![]()